2009-12-13

Galton's quincunx in R

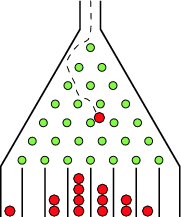
Andrej Blejec has a very nice R demo of Galton's quincunx (link1, link2). It is a bit tedious to copy the code from PDF to R console, but it is worth the effort as the demo simulation clearly shows the nature of quincunx. After a bit of search I also found a similar function quincunx in the animation R package by Yihui Xi.


Image source: Wolfram MathWorld

2009-11-20

Components of genetic improvement

I caught a quote (by Blasco) at the ACTEON maling list: "The genetic improvement applied is 15% science and 85% sociology." - translated by Google

2009-11-16

Phenotype MicroArrays - building the hierarchy in biology

I got an e-mail in my box about the presentation of Phenotype MicroArrays (PM) at our department. I will not be able to attend it, but this site describes the idea behind it. This "tool" is a nice addition to a set of DNA/RNA and protein arrays. Adding PM means that we can move one layer above the gene-protein layer. However, as my interest often lies in ultimate phenotype of an individual that we observe, we are still some layers far from deciphering the role of genes on the ultimate phenotype.


Source: http://www.biolog.com

2009-11-15

Slick correlation "plots"

Slick correlation "plots" in Wikipedia entry for correlation. I just wonder if correlation should really be zero for the (3,2)-th case. I woukd say it should be slightly more than zero.

2009-11-12

Sweave-Lyx from terminal on Mac

Mark Heckmann writes:
In your paper "Using Sweave with Lyx" (great work bty) you pointed out that one can see the sweave error code when processing when starting lyx from the terminal. I just changed from Windows to Mac so that's new for me. Could you send me a few lines how to do that, that is how to operate lyx from terminal and sweave the content from the terminal.
I am not familiar with Mac, though would be happy to own one;) Since Mac OS is build on top of some linux/unix like system you need to start the terminal (console) with shell and find the lyx binary. Perhaps something like this on my linux box (text following $ are shell commands)

# Find the lyx binary
$ which lyx
/usr/bin/lyx

# Start lyx from console
$ lyx&

2009-10-13

Free copy of book by Hastie, Tibshirani, and Friedman

Hastie and Tibshirani mentioned in their course in Krems am Donau (Austria) that the last edition of their book "The Elements of Statistical Learning: Data Mining, Inference, and Prediction" will be freely available. It is true! You can fetch a free copy from Hastie's webpage (8.2 MB).

RExcel

I am not a fan of MS Windows software. However, the reality is that majority of people use it and it is often easier for me to live with this than to convert the sorounding souls. Additionally I am find ing out lately that majority of my favourite open-source programs work on all major platforms: MS Windows, Mac, and UNIX/Linux. Then there is no problem for me to work on any of these systems. MS Excel tool is similarly very widely used by mases, but not really powerfull when it comes to data analysis. However, we must admit that it is jolly usefull for handling medium sized data and that majority of people perform analyses with Excel. For those that can not live without Excel and have some working knowledge of R I suggest to take a look at the RExcel and its demo video (28 min!). It seems to be very nicely integrated - Excel keeps tracks of all the dependencies, while R takes care of the computations. Of course you can do the same stuff in R, by reruning the script for each change, but the interactivity offered by the Excel has its own merit. Regarding the quality of graphics it is obvious that Excel plots can not match with R. But if you need some interactivity (imagine you would like to study the effect of a particular parameter on distribution density), then Excel plots are good enough.
2009-10-02

smoothScatter in base R

smoothScatter function is now available also in base R - in the recommended package graphics that is shipped with R. Originally this function was in the genepplotter package from Bioconductor. I really like it since it can nicely plot large datasets. Bellow is an example figure (also available at R Graph Gallery). Simply start R and type ?smoothScatter to get familiar with this function.

New version of Pedigree Viewer

Brian and Sandy Kinghorn have made quite some changes to the popular Pedigree Viewer program. In particular they added the mate-selection module. I definitely have to try it out!